Recently I wrote about how I've been using a custom tracking solution to inform better product decisions. So in the interest of complete transparency, and for those looking to do the same, here's how it works.
Why build your own?
There's a lot of free tracking products already on the market; MixPanel and Google Analytics are both great solutions I've used in the past. However, there were three main reasons I chose to roll my own:
Speed: The speed and performance of Prevue is so important, it's what makes using the product enjoyable — so almost every technical decision is made with this in mind. And although claiming to be lightweight, quite a few of these tracking tools come with some weighty overhead that ultimately slows the site down. Ultimately, I didn't want users downloading or uploading additional or unnecessary files - just so that I can benefit from their results. Speed is everything.
Simplicity: Those existing tools come with a lot of fancy features, and collect a lot of data I'd probably never use⦠why gather more information when the bare basics are enough?
Privacy: There's the obvious benefits of having all that tracking information reside on your own servers - information I can access, analyse and build on in any way I see fit. Similarly, and equally as important is my desire to keep that same information private, and out of the hands of third parties (however reputable they claim to be). Ultimately the privacy and anonymity of my customers is something that cannot be underestimated.
What to measure
Once I'd decided to build a custom solution, the biggest question was what data I should be recording. Resisting the strong temptation to record every last iota of information available, I'd decided that the bare minimum was all I needed. That bare minimum was split into two categories:
Pageloads: What pages are loaded, in what order? At the very least, that information describes the paths people take through the product. E.g. Visited Groups index at 1:15pm
Actions: What specific actions are being performed, plus any additional information that might enhance my understanding of that action. E.g. Upload error at 2:03am - "File too big (3.6Mb)"
How to measure?
Both pageloads and actions end up in the same database, but how they get there is different depending on type.
Firstly, pageloads are recorded using an AJAX call that gets triggered once a page finishes loading. You can see it sitting at the bottom of each page you visit:
juicy();
The call is extremely lightweight, the main function is bundled in an existing JavaScript file served up from a CDN, which means it's crazy fast and there's no additional files to load. The additional benefit of using asynchronous Javascript is that your browser isn't waiting around for the app to track your visit — if the server takes some time to respond, or the tracking fails entirely, page load-times aren't in the least bit affected.
The drawback of this method is that some visits won't be recorded if Javascript is turned off, or it doesn't have time to fully load⦠but for the sake of a few missing entries, that doesn't bother me at all.
The actions data is recorded in the backend, using a tiny PHP function, and making use of the already-open database connections used to perform those actions. Only the information that is already being processed is used in making that recording - which means that the server isn't slowed down with extra calculations or queries. The function goes a little something like:
trackAction($actionName, $details=NULL);
Output
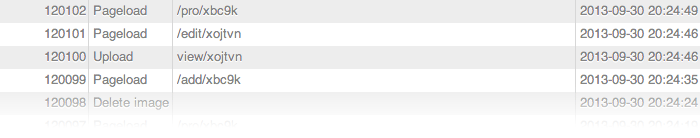
From past experience, I knew that if I didn't immediately build a simple way to view and interpret that information — I'd get completely lost in a sea of data... after all, even on a quiet day tens of thousands of items are being recorded. Here's what a mere 20 seconds looks like:
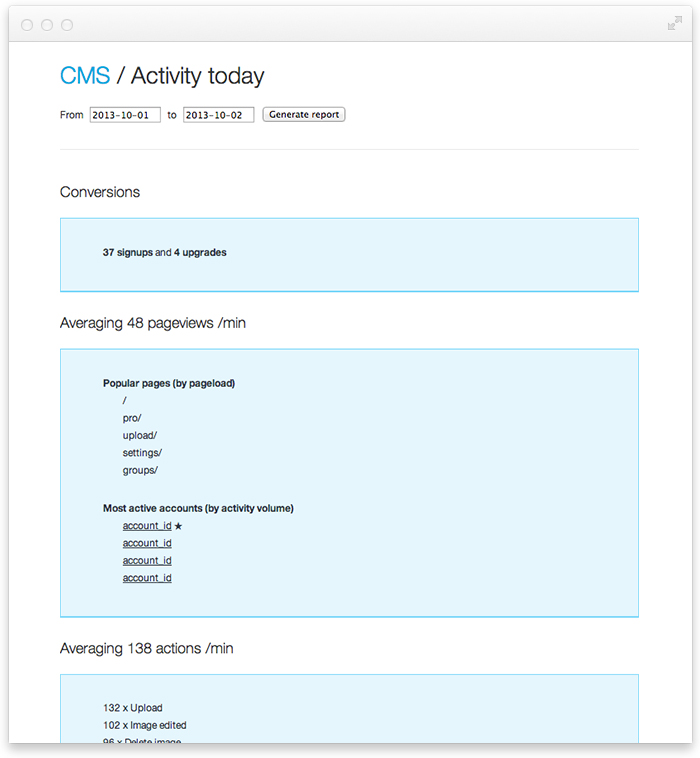
So as a starting point, I built a very simple tool that analysis all the data between two dates — and outputs the results in the least glamorous way possible. Here's a screenshot of how it all comes together:
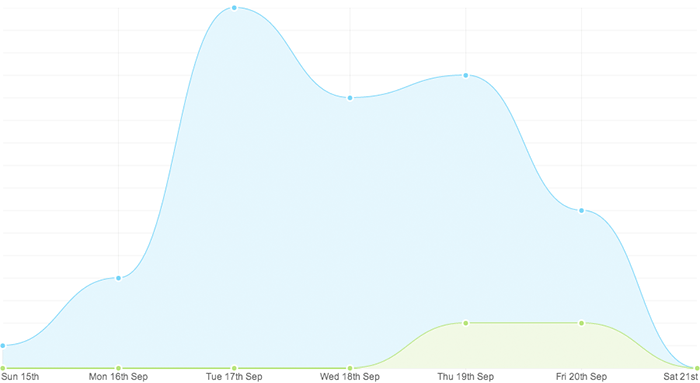
Of course once you know what you're working with, the data can be analysed and output in extremely bespoke and useful ways — for example, I can output upload frequency to tell which days are the most popular:
The possibilities are endless, but as a starting point it's exactly what I need to start make decisions like this.
live 22858
scr888
Jere